![]() CARIS HPD Paper Chart Editor
CARIS HPD Paper Chart Editor
![]() CARIS HPD Product Editor
CARIS HPD Product Editor
![]() CARIS HPD Source Editor
CARIS HPD Source Editor
Pop-up | Add Layer(s) > Classification (Layers window) |
Create layers based on the values of an attribute in a data source.
Classification can be used with several vector formats, such as Shapefiles, GML, GeoPackage, AutoCAD and CARIS DES. It also works with database object layers. It is not compatible with HOB and S-57 ENC data. |
Layers are generated based on a classification type and an interval. You can set colours and patterns to let data values be quickly identified in the display.
A group is created and the generated layers are added to it.
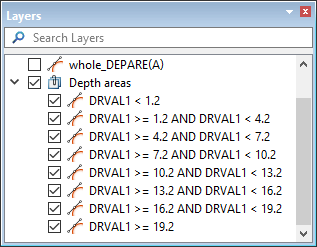
The layers are named based on the attribute and the range of values.
Interface

Option | Description | |
|---|---|---|
Name | The name for the group that will contain the classification layers. | |
Classification Type | The type of classification rule to apply. The choices are: • • • | |
General | Attribute | The attribute on which the classifications are based. Available attributes are taken from the catalogue of the layer for which classifications are being created. |
Number of Values/Interval Size/Number of Classes | The interval at which to create classifications. The name of this field will change based on the selected Classification Type. | |
Display | Colour Symbols | The colour map to apply to symbols in each of the classification layers. 1. Click the check box to enable the option. 2. Select a colour map from the list. |
Colour Lines | The colour map to apply to lines in each of the classification layers. 1. Click the check box to enable the option. 2. Select a colour map from the list. | |
Fill Polygons | The colour map to apply topolygons in each of the classification layers. 1. Click the check box to enable the option. 2. Select an colour map from the list. | |
Hatch Style | The hatch style to apply to the objects in the classification layers. 1. Click the check box of each hatch style to be applied. | |
Hatch Colour | The colour map to use when colouring hatch styles in each of the classification layers. 1. Click the check box to enable the option. 2. Select an colour map from the list. | |
Symbol Sizes | The range of symbol sizes to be coloured according to the colour map file selected for symbols. 1. Click the check box to enable the option. 2. Type a Start Size in millimetres at display scale. 3. Type an End Size in millimetres at display scale. | |
Line Sizes | The range of line sizes to be coloured according to the colour map file selected for lines. 1. Click the check box to enable the option. 2. Type a Start Size in millimetres at display scale. 3. Type an End Size in millimetres at display scale. | |
Procedure
1. Select the layer for which you want to create classification layers.
2. Select the Create Layer by Classification command.
The New Classification dialog box is displayed.
3. Enter a Name for the group that will contain the classification layers.
4. Select the Classification Type.
5. Select the Attribute to classify by.
6. Specify the interval for the attribute value classification rules.
7. Define any necessary portrayal options.
8. Click OK.
A new group containing the resulting classification layers is added to the Layers window. Each layer will be named according to the rule generated for the classification criteria.