![]() CARIS HPD Paper Chart Editor
CARIS HPD Paper Chart Editor
![]() CARIS Paper Chart Composer
CARIS Paper Chart Composer
Menu | Window > Sheet Window |
Show a chart sheet in the Display window.
Related commands:
• • • • | • • • |
Procedure
1. Do one of the following:
• Select the Sheet Window command.
• Select the Sheet Window tab in the Display window.
The Sheet window is displayed.
Rulers
The Sheet window can display rulers. Rulers assist with positioning features in a chart. As you zoom into and out of a panel, rulers adjust to the zoom level. Units are in centimetres.
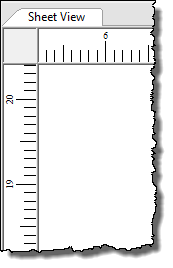
By default, rulers are visible, but can turned off from the Paper Space section of the Options dialog box.
1. Select the Options command.
The Options dialog box is displayed.
2. Select Paper Space from the list on the left of the dialog box.
3. Set Rulers to True (visible) or False (not visible).
Guide Lines
Guide lines serve as a visual reference for positioning chart features. Features can also be snapped to guide lines for precise positioning. Guidelines are active only while rulers are visible.
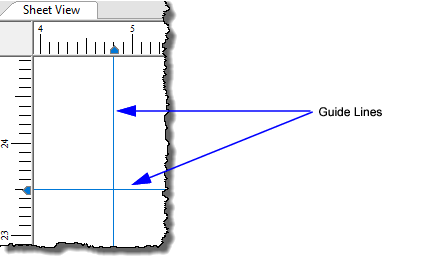
To apply guide lines:
1. Position the cursor on the ruler and click the mouse.
A guide line is added to the sheet.
2. [Optional] Click on the opposite ruler to add an intersecting guide line.
3. To move a guide line, position the cursor on the tab and drag it to a new position.
During digitization, feature vertices can be snapped to a guide line.
4. To snap a feature to a guide line, select Use guide lines from the Snap/Grab layer list in the toolbar.

5. Click on the guide line to insert the vertex.
Margins
Margins are visual aids for focusing on a specific sheet area.
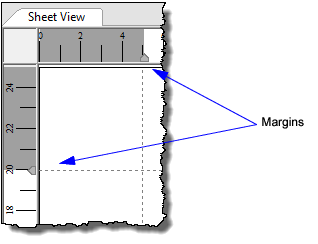
To set margins:
1. Position the cursor over a margin tab in the ruler and drag the margin to a new position.