Paper charts in HPD are digital representations of charts that are eventually exported to a raster file or sent to a printer or plotter.
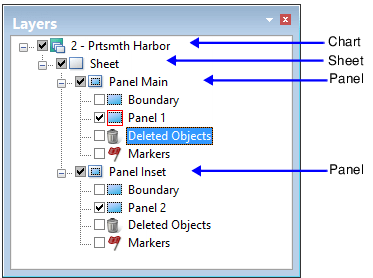
Paper charts are organized in a Chart/Sheet/Panel hierarchy.
Each chart contains a sheet and a sheet contains one or more panels. This Chart/Sheet/Panel hierarchy is shown below.
• The chart layer contains product metadata. These include chart name, edition number and publication date.
• The sheet is the paper on which the chart is printed. The sheet contains dimensions and orientation.
• Panels are geographic areas that contain data. Charts can have more than one panel and each panel can be in a different coordinate reference system.
A panel is represented by a Panel data layer that is identified by a panel number. The Boundary layer contains a boundary feature for each panel.
Chart portrayal
Chart portrayal (presentation) controls the appearance of chart content. Portrayal can be set from either of two attributes:
• on all panels using the Chart Presentation Identifier (chprid) attribute
• on individual panels using the Presentation Identifier (presid) attribute.
Both attributes are located in the Attributes window.
See the Portrayal Guide for descriptions of files that control portrayal.